Investment-ready spatiotemporal intelligence platform

4D platform connecting cities, networks and critical events into an infinitely extensible layer for intelligent decisions

Atlas4D turns raw sensor chaos (radar, IoT, weather, networks, events) into one real-time "4D brain" that understands, predicts and helps you act in space and time.

0
Spatiotemporal events processed
0
Microservices & AI engines
0
× faster geospatial rendering

For investors & strategic partners

Atlas4D is a working deep-tech platform – not a slide deck. Built to scale from a single city to an entire country.

The problem

Critical infrastructure, airspace and networks generate massive spatiotemporal data, but tools are siloed: radar, weather, IoT, video, events, network monitoring – all live in separate systems with no unified “4D brain”.

🧠

The Atlas4D answer

A unified 4D fabric (space + time) that ingests radar, weather, IoT, vision, events and network metrics into one model, with STSQL, NLQ and AI services on top – ready for real-time decisions.

📈

Status today

22+ microservices, live radar & weather fusion, threat forecasting, Network Guardian, event risk module with MALP calibration, full observability (Prometheus + Grafana) and running infrastructure.

🎯

Initial markets

Public safety & airspace security, telco & network operations, smart city command centers, large event operators and critical infrastructure providers.

🧱

Defensibility

Deep database + geospatial architecture, 4D data model, multi-sensor fusion engine, and domain-specific AI modules built on open standards (PostGIS, H3, Timescale, pgvector).

🤝

What’s next

1–2 lighthouse pilots with a city, telco or infrastructure partner, hardened multi-tenant cloud version, and regional rollout across SEE / EU.

Stage: pre-seed / seed, founder-led, bootstrapped.

Talk to the founder Open live demo

🔮 The Atlas4D Philosophy

"Atlas4D doesn't log events-it logs the history of movement."

Where is it?

Static data

Where has it been?

Temporal data

Where will it be?

Predictive analytics

⏱️

Temporality

We work with history, not just "state". No overwrites-versioned intervals (valid_from → valid_to).

🌍

Geospatial

STSQL: time + space + motion. Example: "Which drones approached the airport in the last 30 minutes?"

🚀

Forecasting

Trajectory analysis, vectors, and predicting positions N minutes ahead. Alerts before the event.

🏗️

Microservices

Dozens of specialized services-independent yet coordinated (IoT, AI, Weather, Vision).

🔐

Reliability

Idempotency, Snowflake ID, dual-layer auth. Resilient to restarts and network loss.

🤖

AI-Augmented

Digital twin of reality with LLM/NLQ, vector trajectories and predictive models.

🧠 What is Atlas4D, really?

Atlas4D is a 4D spatiotemporal data layer – a database-backed platform that mirrors the real world across space and time.

🗺️

4D Data Layer

Instead of separate systems for GIS, time-series, events and logs, Atlas4D keeps movement in space and time in one model – entities, trajectories, anomalies, threats and events.

🧩

Unified on Postgres

Built on PostgreSQL + PostGIS + TimescaleDB + H3 + pgvector, Atlas4D behaves like a 4D RDBMS: SQL-compatible, observable and production-ready, but with native support for geospatial, temporal and vector AI.

⚙️

From Sensors to Decisions

Radar, weather, IoT, video, network telemetry and events are ingested into a single spatiotemporal model – then exposed via maps, APIs, STSQL and NLQ for cities, telcos and infrastructure operators.

🚀

Built for Real-World Systems

Atlas4D is designed as an infrastructure layer: it runs on your hardware, next to your sensors and existing systems, and complements your current monitoring, GIS and analytics stack instead of replacing it overnight.

📊 STSQL - SQL for Motion

Our spatiotemporal extension for real-time queries

Spatiotemporal Query
Try →
-- Drones near the airport in the last 30 minutes
SELECT *
DURING ["now-30m","now"]
NEAR POINT(42.6977,23.3219)
WITHIN 5km
LIMIT 100;
Trajectory Forecasting
-- Predict position in 10 minutes and check a restricted zone
SELECT entity_id, predicted_position
FROM trajectories
WHERE PREDICT(+10m)
AND INTERSECTS(restricted_zone);
DURING [start,end] - time interval
NEAR POINT(lat,lon) - space
WITHIN radius - georadius
PREDICT(+time) - forecast

Key Capabilities

Everything for spatiotemporal data analytics

Geospatial Intelligence

PostGIS, H3 indexes and STSQL for massive real-time spatial data.

Real Time

TimescaleDB continuous aggregates and materializations for fast dashboards and alerts.

Visualization

MapLibre GL + MVT/PMTiles-millions of points, smooth render without blocking.

AI & NLQ

Integration with Ollama LLM: multilingual NLQ, STSQL generation, trajectory forecasts.

Microservices

IoT, Vision, Radar, Weather, Fusion… each service is a domain expert.

Anomalies & Threats

Anomaly detection and predictive alerts with fusion and ML.

See the platform in action

Real-time geospatial analytics and visualization
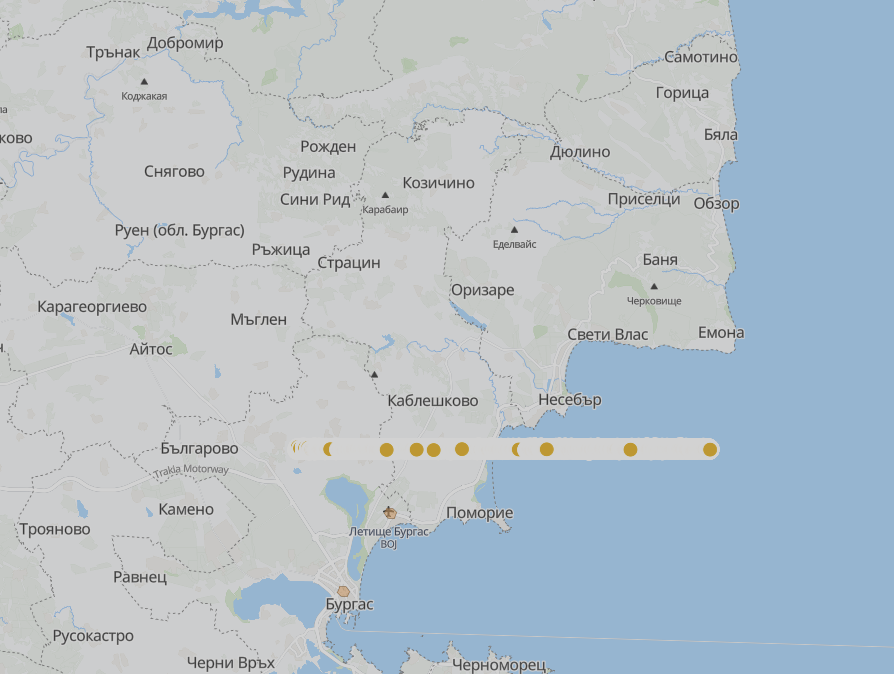
Fleet Tracking - real time

🚗 Fleet Tracking

Vehicle positioning with MVT tiles

Interactive map

🗺️ Interactive Map

MapLibre GL with Bulgaria coverage

Control panel

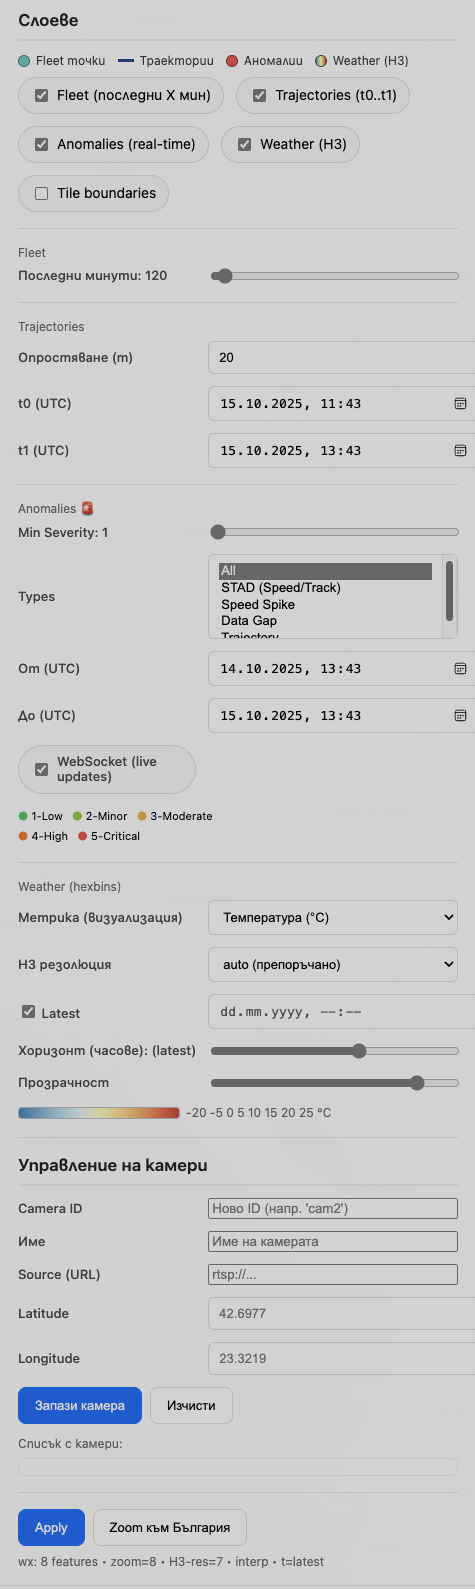
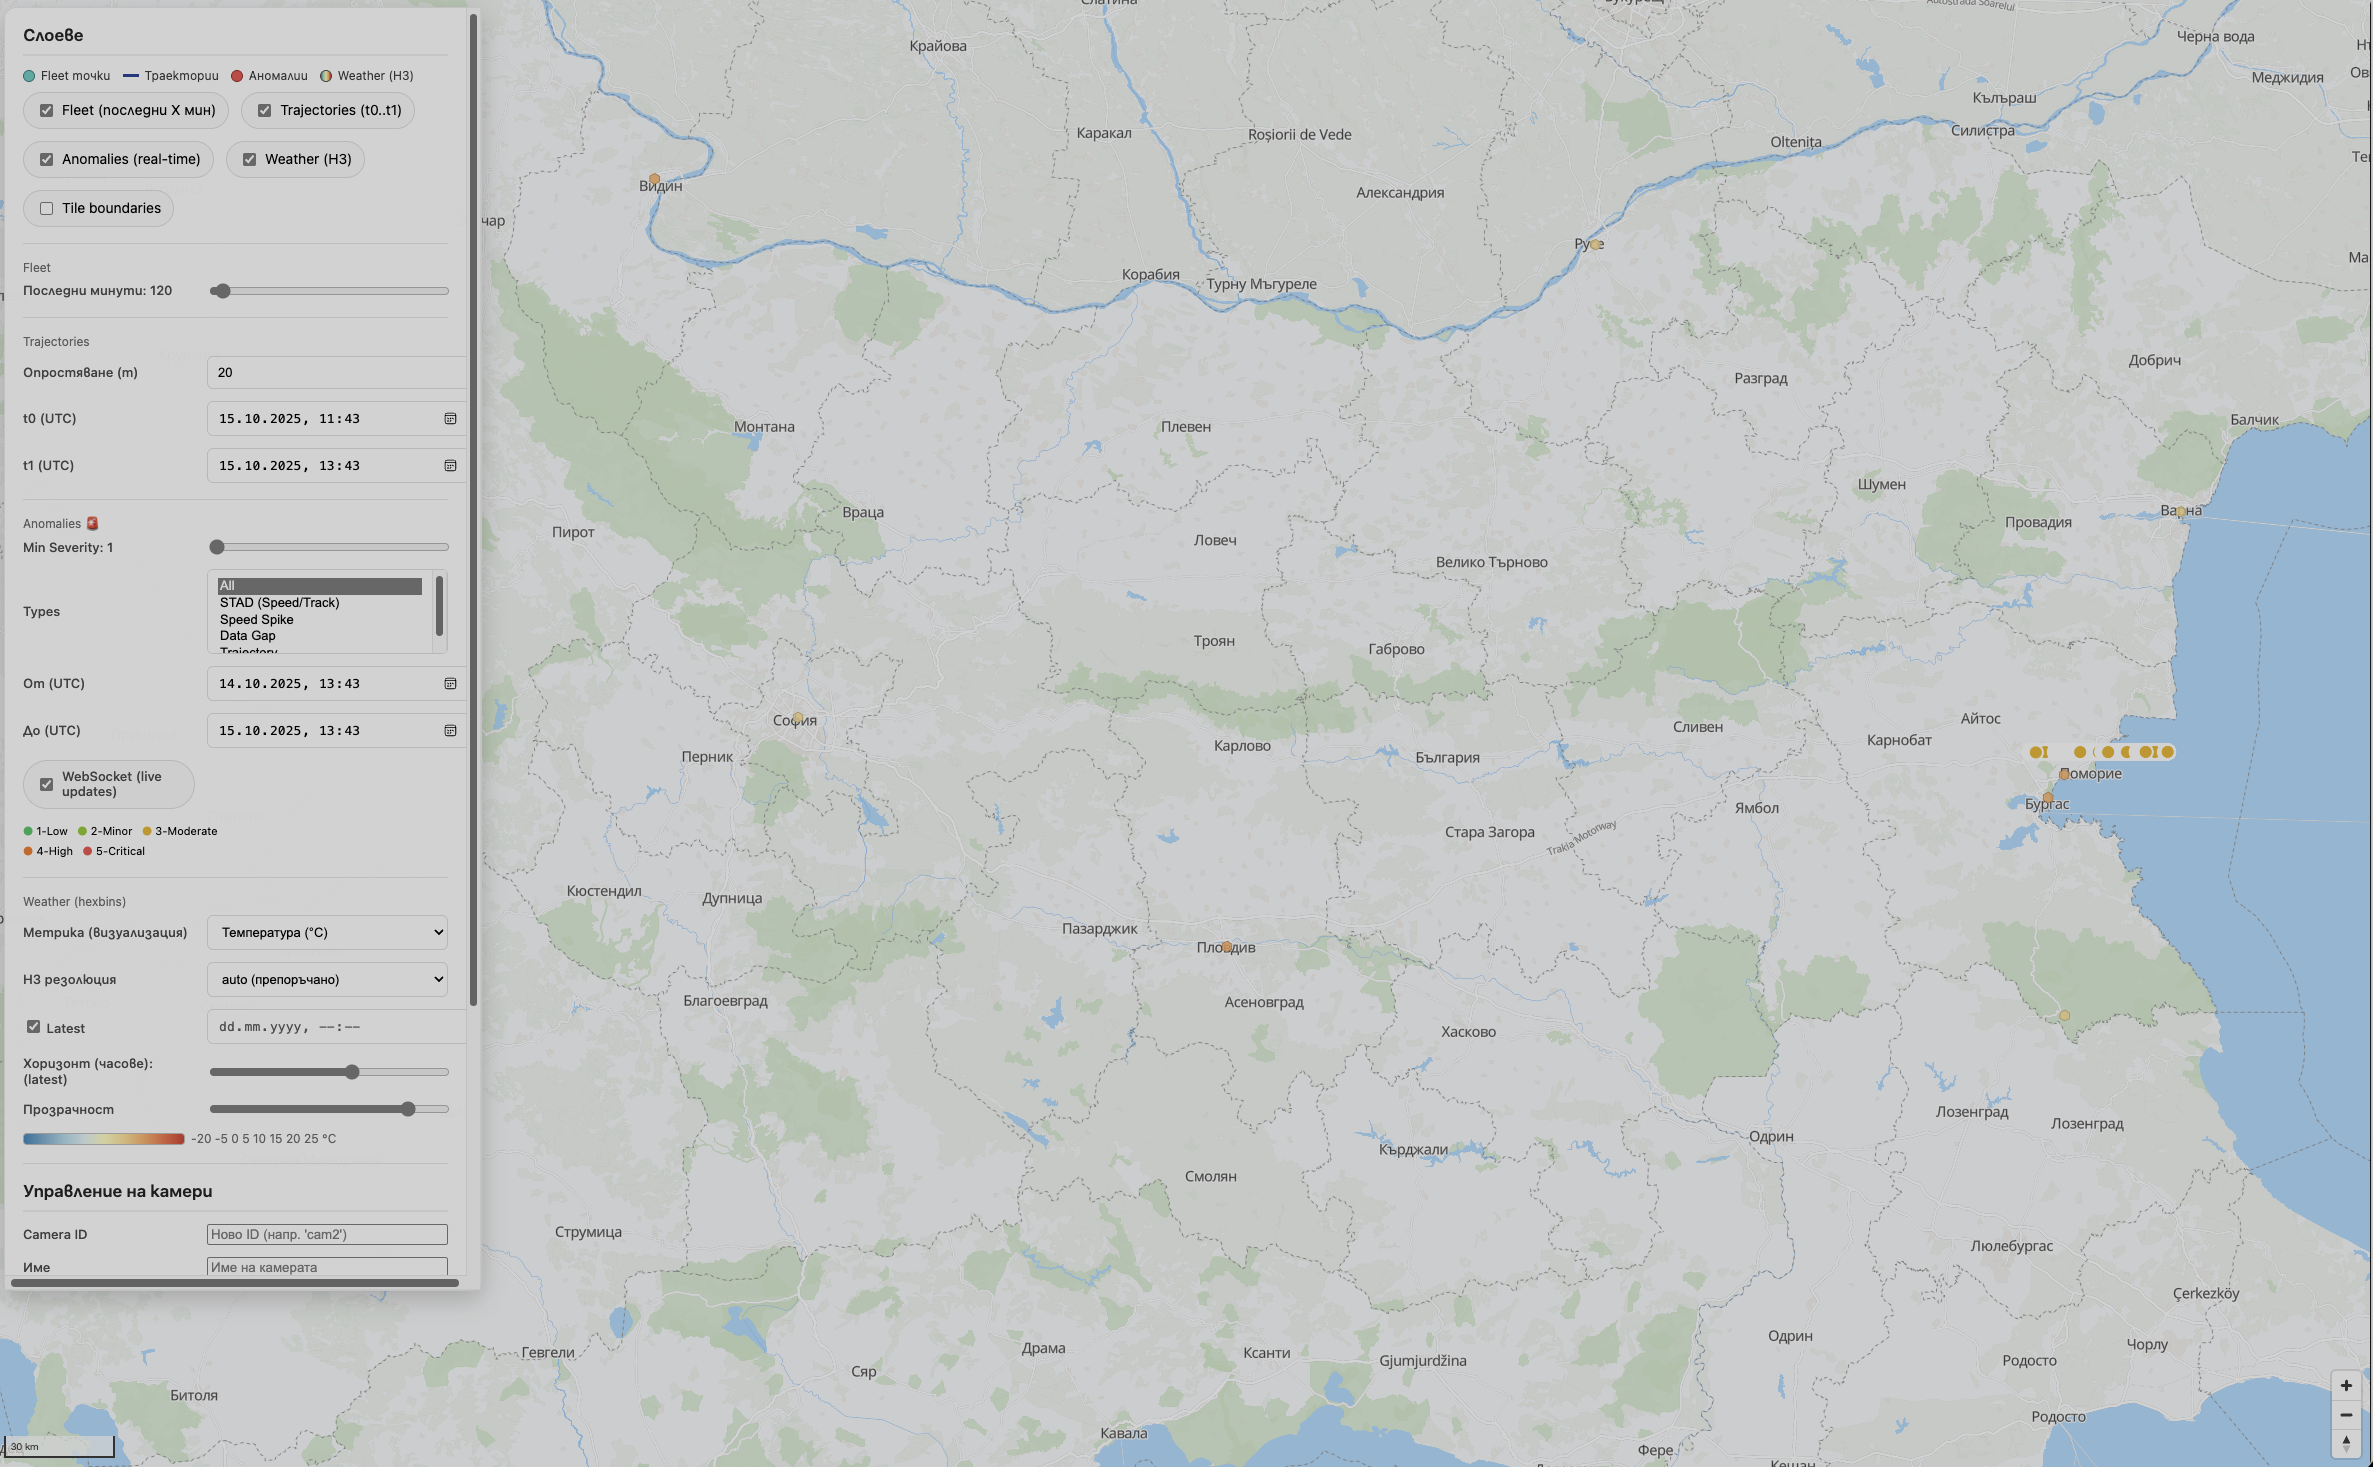
⚙️ Advanced Controls

Filters by time, type, severity and location

Weather analytics on H3

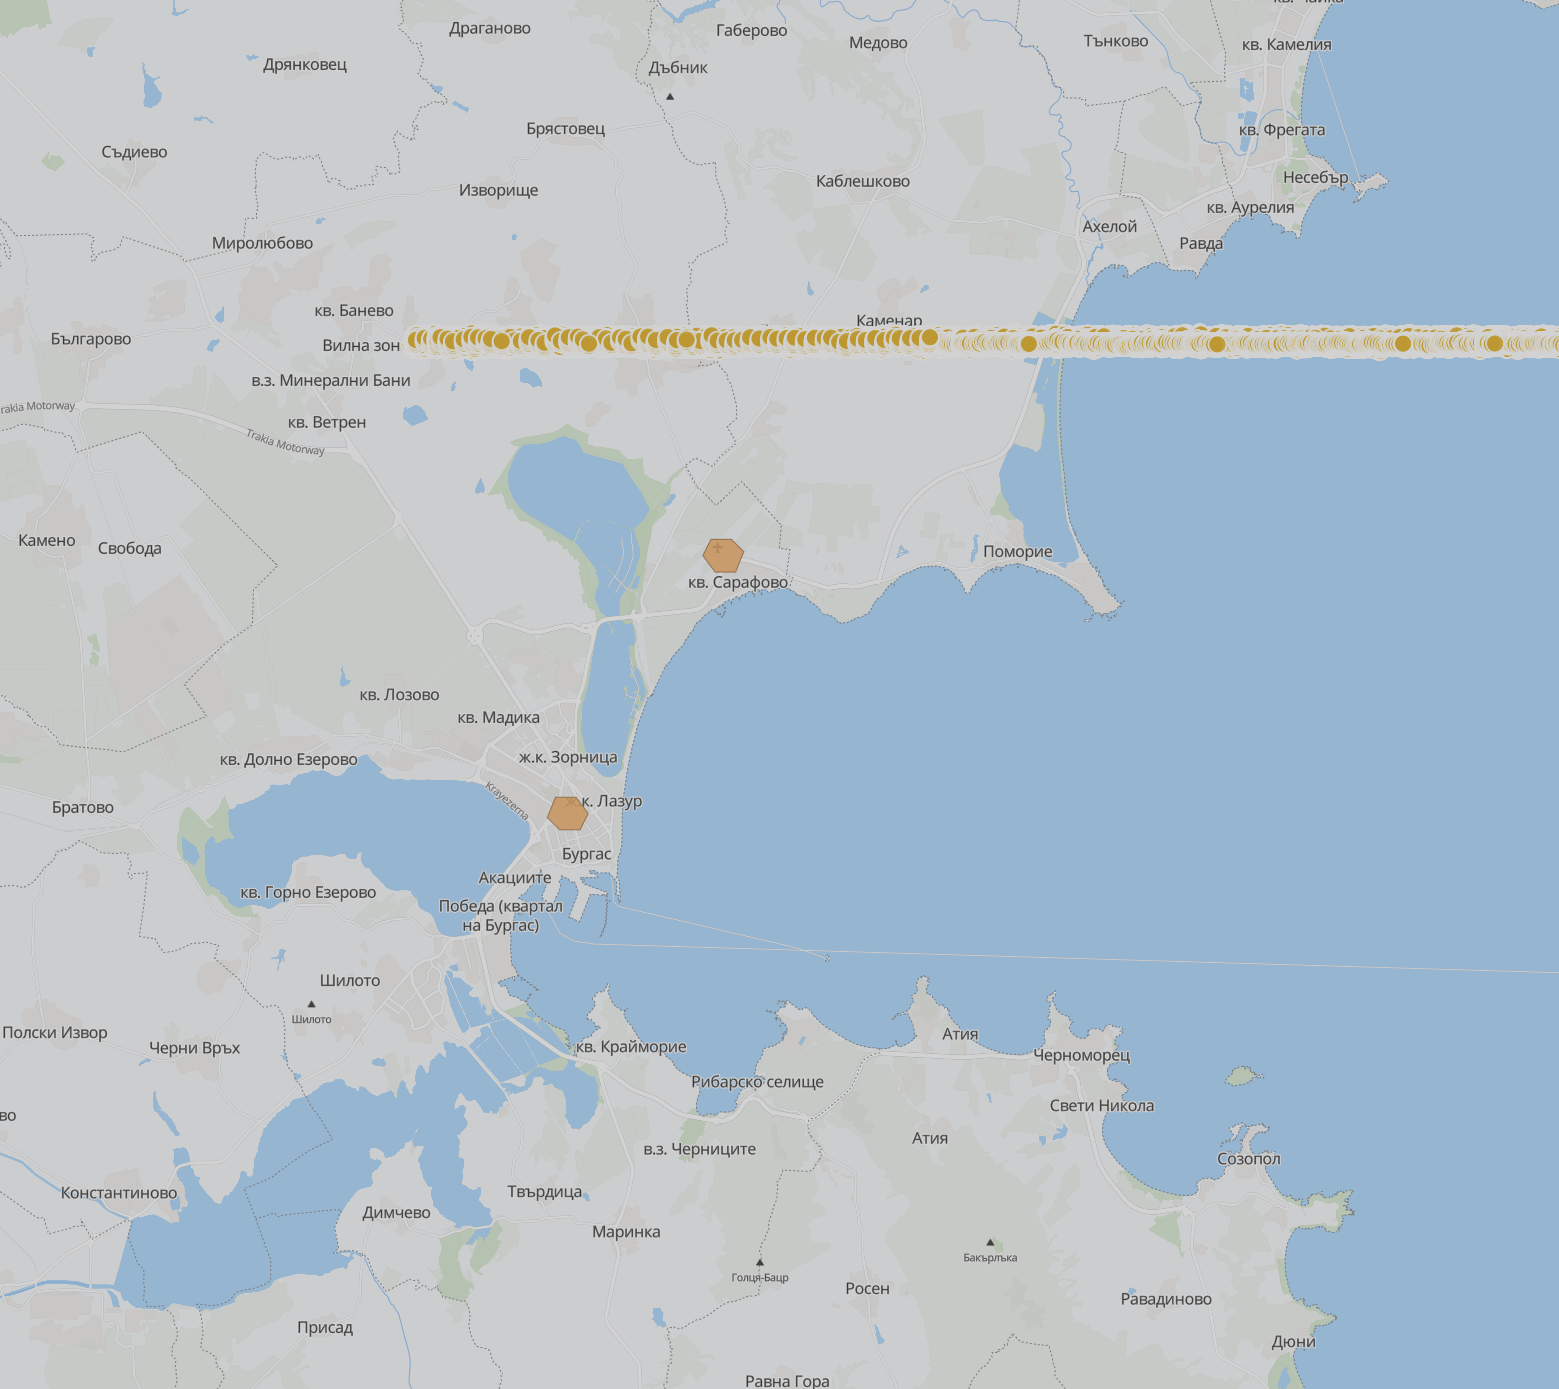
🌦️ Weather + Anomalies

H3 hexagonal binning with real-time data

🏗️ Microservice Ecosystem

Specialized services working in sync

🌐 Frontend & Gateway

🎨
Frontend

MapLibre GL + React interface

🚪
API Gateway

Routing, auth, rate limiting

🔐
Auth Service

JWT authentication

📡 Data Ingestion

📥
Public API

External data ingestion

🔌
IoT Service

IoT device processing

📹
Cam Hook

Camera feed integration

🤖 AI & Analytics

💬
NLQ Service

Natural Language → STSQL

👁️
Vision Service

AI video/images

📊
Trajectory Embedding

Vectorization

🔮
Trajectory Prediction

Forecasts

⚠️ Anomaly Detection

🔍
Anomaly Service

Pattern-based

🧬
Anomaly Fusion

Correlation

Threat Forecaster

Predictive analysis

📡 Edge Processing

📡
Radar Edge

Realtime radar

🔊
Acoustic Edge

Audio analytics

🔄 Data Fusion

🎯
Fusion Coordinator

Orchestration

🔗
Fusion Service

Merging

🌤️ Environmental

🌡️
Weather Service

H3-indexed

☁️
Weather Fetcher

Integrations

⚙️ Execution & Legacy

🔧
WASM Exec

WebAssembly

🎰
WASM Predict

ML inference

🗄️
Monolith API

Legacy bridge

🔮 Predictive Threat Forecasting

AI-powered risk assessment combining LSTM trajectory predictions, weather hazards, and anomaly patterns

🧠

LSTM Predictions

86.9%

Trajectory risk score
20 trajectories analyzed

🌤️

Weather Hazards

22.5%

Wind & storm risk
Real-time conditions

H3 Resolution

R9

~0.1 km² cells
174m edge length

⏱️

Forecast Window

30min

Prediction horizon
Configurable per request

Threat Level Classification

LOW

Score: 0.0 - 0.3

MEDIUM

Score: 0.3 - 0.7

HIGH

Score: 0.7 - 1.0

Multi-Source Fusion Algorithm

40% Weight
Anomaly Detection
Pattern-based risk scoring
35% Weight
Weather Hazards
Wind, storms, conditions
25% Weight
LSTM Trajectories
Prediction deviation analysis

API Endpoint: POST /api/threats/forecast

// Request
{
  "lat": 42.5048,
  "lon": 27.4626,
  "horizon_minutes": 30
}

// Response
{
  "threat_level": "medium",
  "threat_score": 0.313,
  "trajectory_score": 0.897,
  "weather_score": 0.255,
  "confidence": 1.0
}
Launch Threat Forecasting Interface →

🛡️ Network Guardian v1.0

Real-time network infrastructure monitoring with geospatial intelligence and semantic search capabilities

13,000+
Active Observations
H3 + PostGIS
Geospatial Indexing
pgvector
Semantic Search
90-Day
Retention Policy
📊

SNMP Monitoring

  • ✓ Template-based metric collection
  • ✓ Interface bandwidth tracking
  • ✓ 30s ping / 5min SNMP cycles
  • ✓ TimescaleDB hypertables
🗺️

Geospatial Intelligence

  • ✓ H3 hexagonal indexing
  • ✓ PostGIS geometry support
  • ✓ MVT tile rendering
  • ✓ MapLibre GL integration
🤖

Semantic Search

  • ✓ Ollama embeddings (768-d)
  • ✓ pgvector similarity search
  • ✓ Hybrid semantic+geo+time
  • ✓ Natural language queries
🚨

Alert Management

  • ✓ Multi-channel notifications
  • ✓ Email + webhook support
  • ✓ Customizable thresholds
  • ✓ Prometheus metrics export

STSQL Queries

  • ✓ Spatiotemporal SQL adapter
  • ✓ Complex correlation queries
  • ✓ Cross-layer analysis
  • ✓ Real-time aggregations
👁️

Unified Observations

  • ✓ v_netguard_observations view
  • ✓ Device + metric unification
  • ✓ Geographic enrichment
  • ✓ Temporal indexing

Architecture Overview

┌─ Network Devices
│   └─ SNMP/Ping Workers
│       ├─ ping_worker (30s intervals)
│       └─ snmp_worker (5min intervals)
│           └─ Template-based collection
│
├─ Data Layer
│   ├─ TimescaleDB (metrics hypertables)
│   ├─ PostGIS (geospatial geometries)
│   ├─ H3 (hexagonal indexing)
│   └─ pgvector (embeddings storage)
│
├─ Processing Layer
│   ├─ Ollama (embeddings generation)
│   ├─ Alert Worker (threshold monitoring)
│   └─ STSQL Adapter (query compilation)
│
└─ Presentation Layer
    ├─ MVT Tiles (MapLibre GL)
    ├─ REST API (FastAPI)
    ├─ Prometheus Metrics
    └─ Web Dashboard

Semantic Search Query: GET /api/netguard/search

// Query devices with performance issues near Burgas
{
  "query": "network devices with high latency in Burgas region",
  "location": { "lat": 42.5048, "lon": 27.4626 },
  "radius_km": 10,
  "time_range": "last_24h"
}

// Response with hybrid semantic + spatial + temporal results
{
  "results": [
    {
      "device_id": "lb.digicom.bg",
      "semantic_score": 0.89,
      "avg_latency_ms": 145.7,
      "distance_km": 2.3,
      "alert_count": 3
    }
  ]
}
Explore Network Guardian →

⚠️ Event Risk Assessment with MALP

AI-powered attendance prediction with Maximum Adjusted Linear Prediction (MALP) calibration for bias-corrected forecasts

γ = 0.996
MALP Concordance
-2.4%
Avg Bias Correction
BG + EN
Bilingual NLQ
Production
Ready System
🎯

MALP Calibration

  • ✓ Maximum Adjusted Linear Prediction
  • ✓ γ = 0.996 (excellent concordance)
  • ✓ Automatic bias correction
  • ✓ CCC monitoring & safety guards
  • ✓ Transparent adjustments
🌐

Multi-Factor Analysis

  • ✓ Weather impact (rain, temp)
  • ✓ Health indices (flu, COVID)
  • ✓ Calendar context (holidays)
  • ✓ Traffic density (real-time)
  • ✓ Historical patterns
⚖️

Risk Scoring

  • ✓ Attendance risk (capacity)
  • ✓ Weather risk (precipitation)
  • ✓ Traffic risk (congestion)
  • ✓ Combined risk score (0-1)
  • ✓ Confidence intervals
📊

Full Transparency

  • ✓ Base prediction (heuristic)
  • ✓ Calibrated prediction (MALP)
  • ✓ Adjustment delta (Δ)
  • ✓ Calibration method exposed
  • ✓ Confidence scores
🛡️

Safety Guards

  • ✓ Minimum 10 events required
  • ✓ CCC degradation detection
  • ✓ Graceful fallback to heuristic
  • ✓ Auto-calibration on startup
  • ✓ Production logging
💬

NLQ Interface

  • ✓ Bulgarian queries
  • ✓ English queries
  • ✓ Context-aware parsing
  • ✓ Smart clarifications
  • ✓ Detailed explanations

MALP Prediction Workflow

1. Base Prediction (Heuristic Model)
   └─ Multi-factor analysis → base_prediction: 4500

2. MALP Calibration (Bias Correction)
   ├─ γ coefficient: 0.9962
   ├─ Formula: calibrated = γ × base_prediction
   └─ Result: 4390 (adjustment: -110 or -2.4%)

3. Risk Assessment
   ├─ Capacity utilization: 4390 / 5000 = 88%
   ├─ Weather risk: precipitation probability
   ├─ Traffic risk: real-time observations
   └─ Combined risk score: 0.3 (Medium)

4. Response with Transparency
   ├─ predicted_attendance: 4390
   ├─ base_prediction: 4500
   ├─ calibration_method: "MALP"
   ├─ adjustment: -110
   └─ confidence: 0.65

Benefits:
✓ Reduced bias → more accurate predictions
✓ Conservative estimates → better planning
✓ Full transparency → trustworthy results
Event Organizers

Plan staffing, security, and resources with bias-corrected attendance forecasts

Venue Managers

Optimize capacity, pricing, and logistics with MALP-calibrated predictions

City Planners

Coordinate transport and emergency services with accurate crowd size estimates

Data Scientists

Access full transparency: base vs calibrated predictions with adjustment deltas

Risk Assessment API: POST /api/events/risk/assess

// Request - predict with MALP calibration
{
  "event_name": "Summer Music Festival",
  "event_type": "concert",
  "venue_capacity": 5000,
  "location": {
    "city": "Burgas",
    "lat": 42.5048,
    "lon": 27.4626
  },
  "date": "2025-07-15T20:00:00Z"
}

// Response - MALP transparency included
{
  "success": true,
  "predicted_attendance": 4390,
  "base_prediction": 4500,
  "calibration_method": "MALP",
  "adjustment_delta": -110,
  "adjustment_pct": -2.4,
  "risk_assessment": {
    "overall_risk": "Среден",
    "risk_score": 0.3,
    "attendance_risk": 0.88,
    "weather_risk": 0.15
  },
  "confidence": 0.65
}

MALP Statistics API: GET /malp/stats

// Response - calibrator status
{
  "calibrated": true,
  "n_events": 10,
  "gamma": 0.9961950734747499,
  "ccc_before": 0.9855,
  "ccc_after": 0.9733,
  "ccc_improvement_pct": -1.24,
  "data_source": "production",
  "last_calibration": "2025-11-11T14:20:22"
}

// Training endpoint
POST /malp/train?force=false

// Single prediction calibration
POST /malp/calibrate?prediction=7500
Technology Stack: NumPy (MALP calculations), asyncpg (database), FastAPI (API), Pydantic (validation), WeatherAPI, TimescaleDB, PostgreSQL views
Open Event Risk Map → View Event Risk Demo →

💼 For investors & strategic partners

Short version of the Atlas4D investor story: problem → what’s built → where we’re going.

1. The problem

Cities, telcos and infrastructure operators drown in spatiotemporal chaos: radar, weather, IoT, cameras, events, network monitoring – all in separate systems, with no unified 4D view and no "brain" that can predict what comes next.

Decisions are made on Excel, screenshots and phone calls, not on a live model of reality.

2. What’s already working

  • 22+ microservices with 965k trajectory vectors, 25M queryable anomalies, live radar & weather fusion, threat forecasting, Network Guardian, event risk assessment with MALP
  • Real-time 4D map (H3 + PostGIS + TimescaleDB, MVT/PMTiles, up to ~225× faster rendering)
  • NLQ & STSQL interfaces for natural language spatiotemporal queries
  • Deployed, observable instance: atlas4d.tech / atlas4d.digicom.bg

3. Roadmap & stage

Atlas4D is founder-built, bootstrapped and deployment-proven. Next step: productizing the 4D data layer for 1–2 lighthouse customers.

We’re exploring a pre-seed / seed round to:

  • Run 1–2 full pilots (city / telco / infrastructure operator)
  • Harden the SaaS platform (multi-tenant, self-service onboarding)
  • Grow the open SDK ecosystem (Rust / Go / Python clients)

👉 Full investor brief: atlas4d.tech/investors-brief

Modern Technology Stack

The best for maximum performance

Database

🗄️PostgreSQL 16
🌍PostGIS 3.5
⏱️TimescaleDB
🔷H3 Hex Index
❄️Snowflake ID

Visualization

🗺️MapLibre GL
📦MVT Tiles
PMTiles
📊WebSocket

Backend & AI

FastAPI
🐍Python 3.11+
🔄AsyncIO
🤖Ollama LLM
🧠TensorFlow/PyTorch

Infrastructure

🐳Docker Compose
🌐Nginx
🔒SSL/TLS + JWT
📈Prometheus + Grafana

Performance Breakthrough

Before (GeoJSON)
45-90 seconds
~2.3GB transfer Browser freeze
Now (MVT)
~0.4 seconds
100-800 bytes/tile Smooth render
~225× Faster Production-grade performance for millions of points

🚀 Platform Updates

Recent development milestones from Sprint 1–13

💬

NLQ Conversation Memory

Context-aware follow-up queries. Ask "What's the weather in Burgas?" then "And in Sofia?" – it remembers.

Sprint 12 • 40ms cached responses

LLM Performance Boost

Redis intent cache, Ollama pre-warming, weather fast-path. From 21s to 70ms for common queries.

Sprint 12 • 300x faster
📱

Mobile-Ready Navigation

Unified header across all pages with hamburger menu. 7 navigation items: Dashboard, NLQ, Threats, STSQL, NetGuard, Events, Ops.

Sprint 13 • Full responsive
🔥

Fusion Engine 23,000x Faster

Optimized spatial scoring and threshold-aware processing. Real-time threat zone rendering at 0.1ms.

Sprint 7 • Production-ready
🛡️

Network Guardian v1.0

13k+ observations, SNMP/Ping workers, 11 ML models per device, MVT tiles, semantic search with pgvector.

Sprint 9-11 • Live monitoring
📅

Event Risk + MALP

AI attendance prediction with bias-corrected MALP calibration. Weather, traffic, and capacity risk scoring.

Sprint 10 • γ=0.996 calibrated
Explore the Platform →

Atlas4D Use Cases

From safety to smart cities and industry

🛡️

Safety

Drone incursions, anomalous trajectories, predictive alerts.

🏙️

Smart Cities

Airspace, traffic, coordinated incident response.

📡

Telecom

Load forecasts, coverage optimization.

🏭

Industry

Tracking, predictive maintenance, logistics.

🚁

Drone Operations

Routes, collision avoidance, optimal trajectories.

🔌

IoT Analytics

Massive streams, anomalies, smart notifications.

🌐

Infrastructure

Temporal monitoring and change analysis.

🌡️

Meteorology

H3 grid, Open-Meteo integrations and correlations.

Let’s turn Atlas4D into a city-scale nervous system

Atlas4D is already running as a working deep-tech prototype. Looking for investors and strategic partners for the first large-scale deployments.